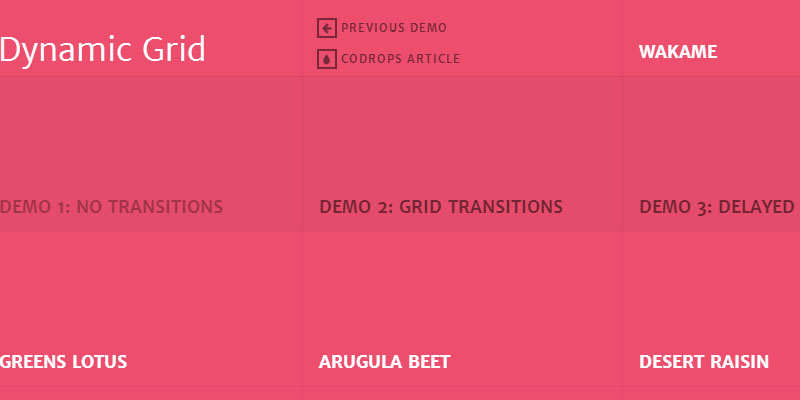
Recently search engine giant Google changed the layout of its hot trending internet topics around the world. Simultaneously it also added a feature called hot trends data visualization, this data visualization has got html5 and css3 based grid layout that is undoubtedly very eye catching, on top left corner you can customize grid layout which drives by awesome transition effects. Check out Google hot trends data visualization

Here in this post I am going to share with you a very similar or just the copycat style of Google hot trends visualization grid layout.
You can see its demo and also download it source to learn the basic of it get inspiration implement in your next web project. All thanks to Codrops development team.
|
[button color=”red” size=”small” link=”http://tympanus.net/codrops/2013/06/19/dynamic-grid-with-transitions/” target=”blank” ]Access Tutorial[/button] |
[button color=”red” size=”small” link=”http://tympanus.net/Development/DynamicGrid/” target=”blank” ]Demo[/button] |
[button color=”red” size=”small” link=”http://tympanus.net/Development/DynamicGrid/DynamicGrid.zip” target=”blank” ]Download Source[/button] |


